Mortality & Hospitalization

Mortality

Mortality and Case Rate

The Lethality and Case Count of COVID-19 is not much higher than a medium to moderately severe influenza.
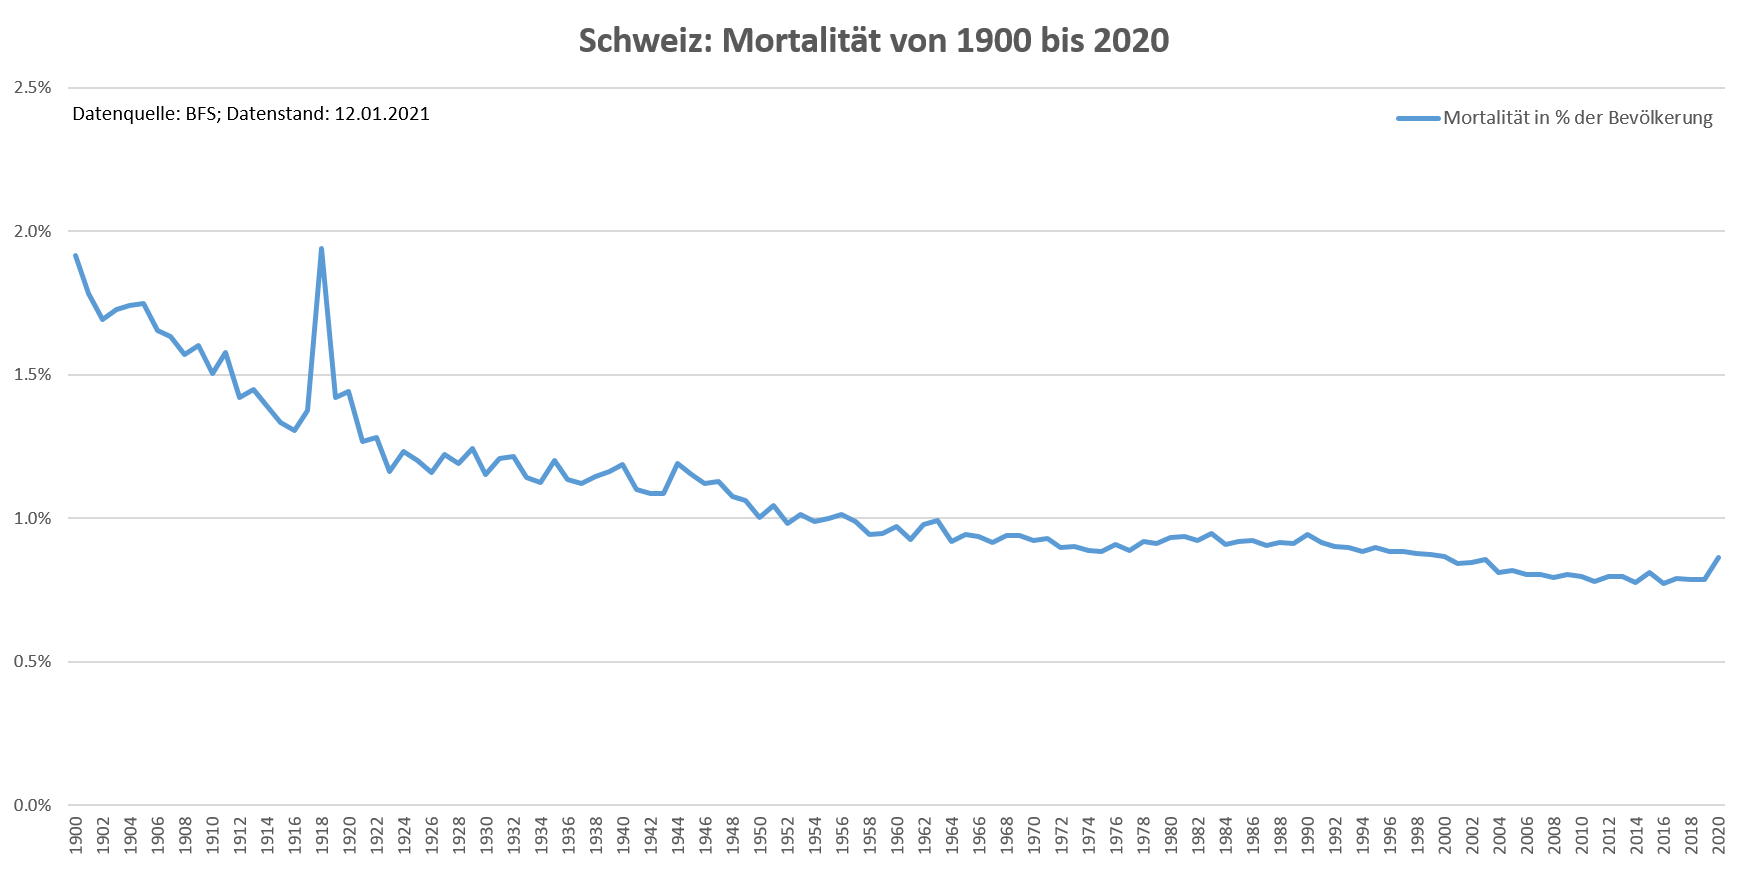
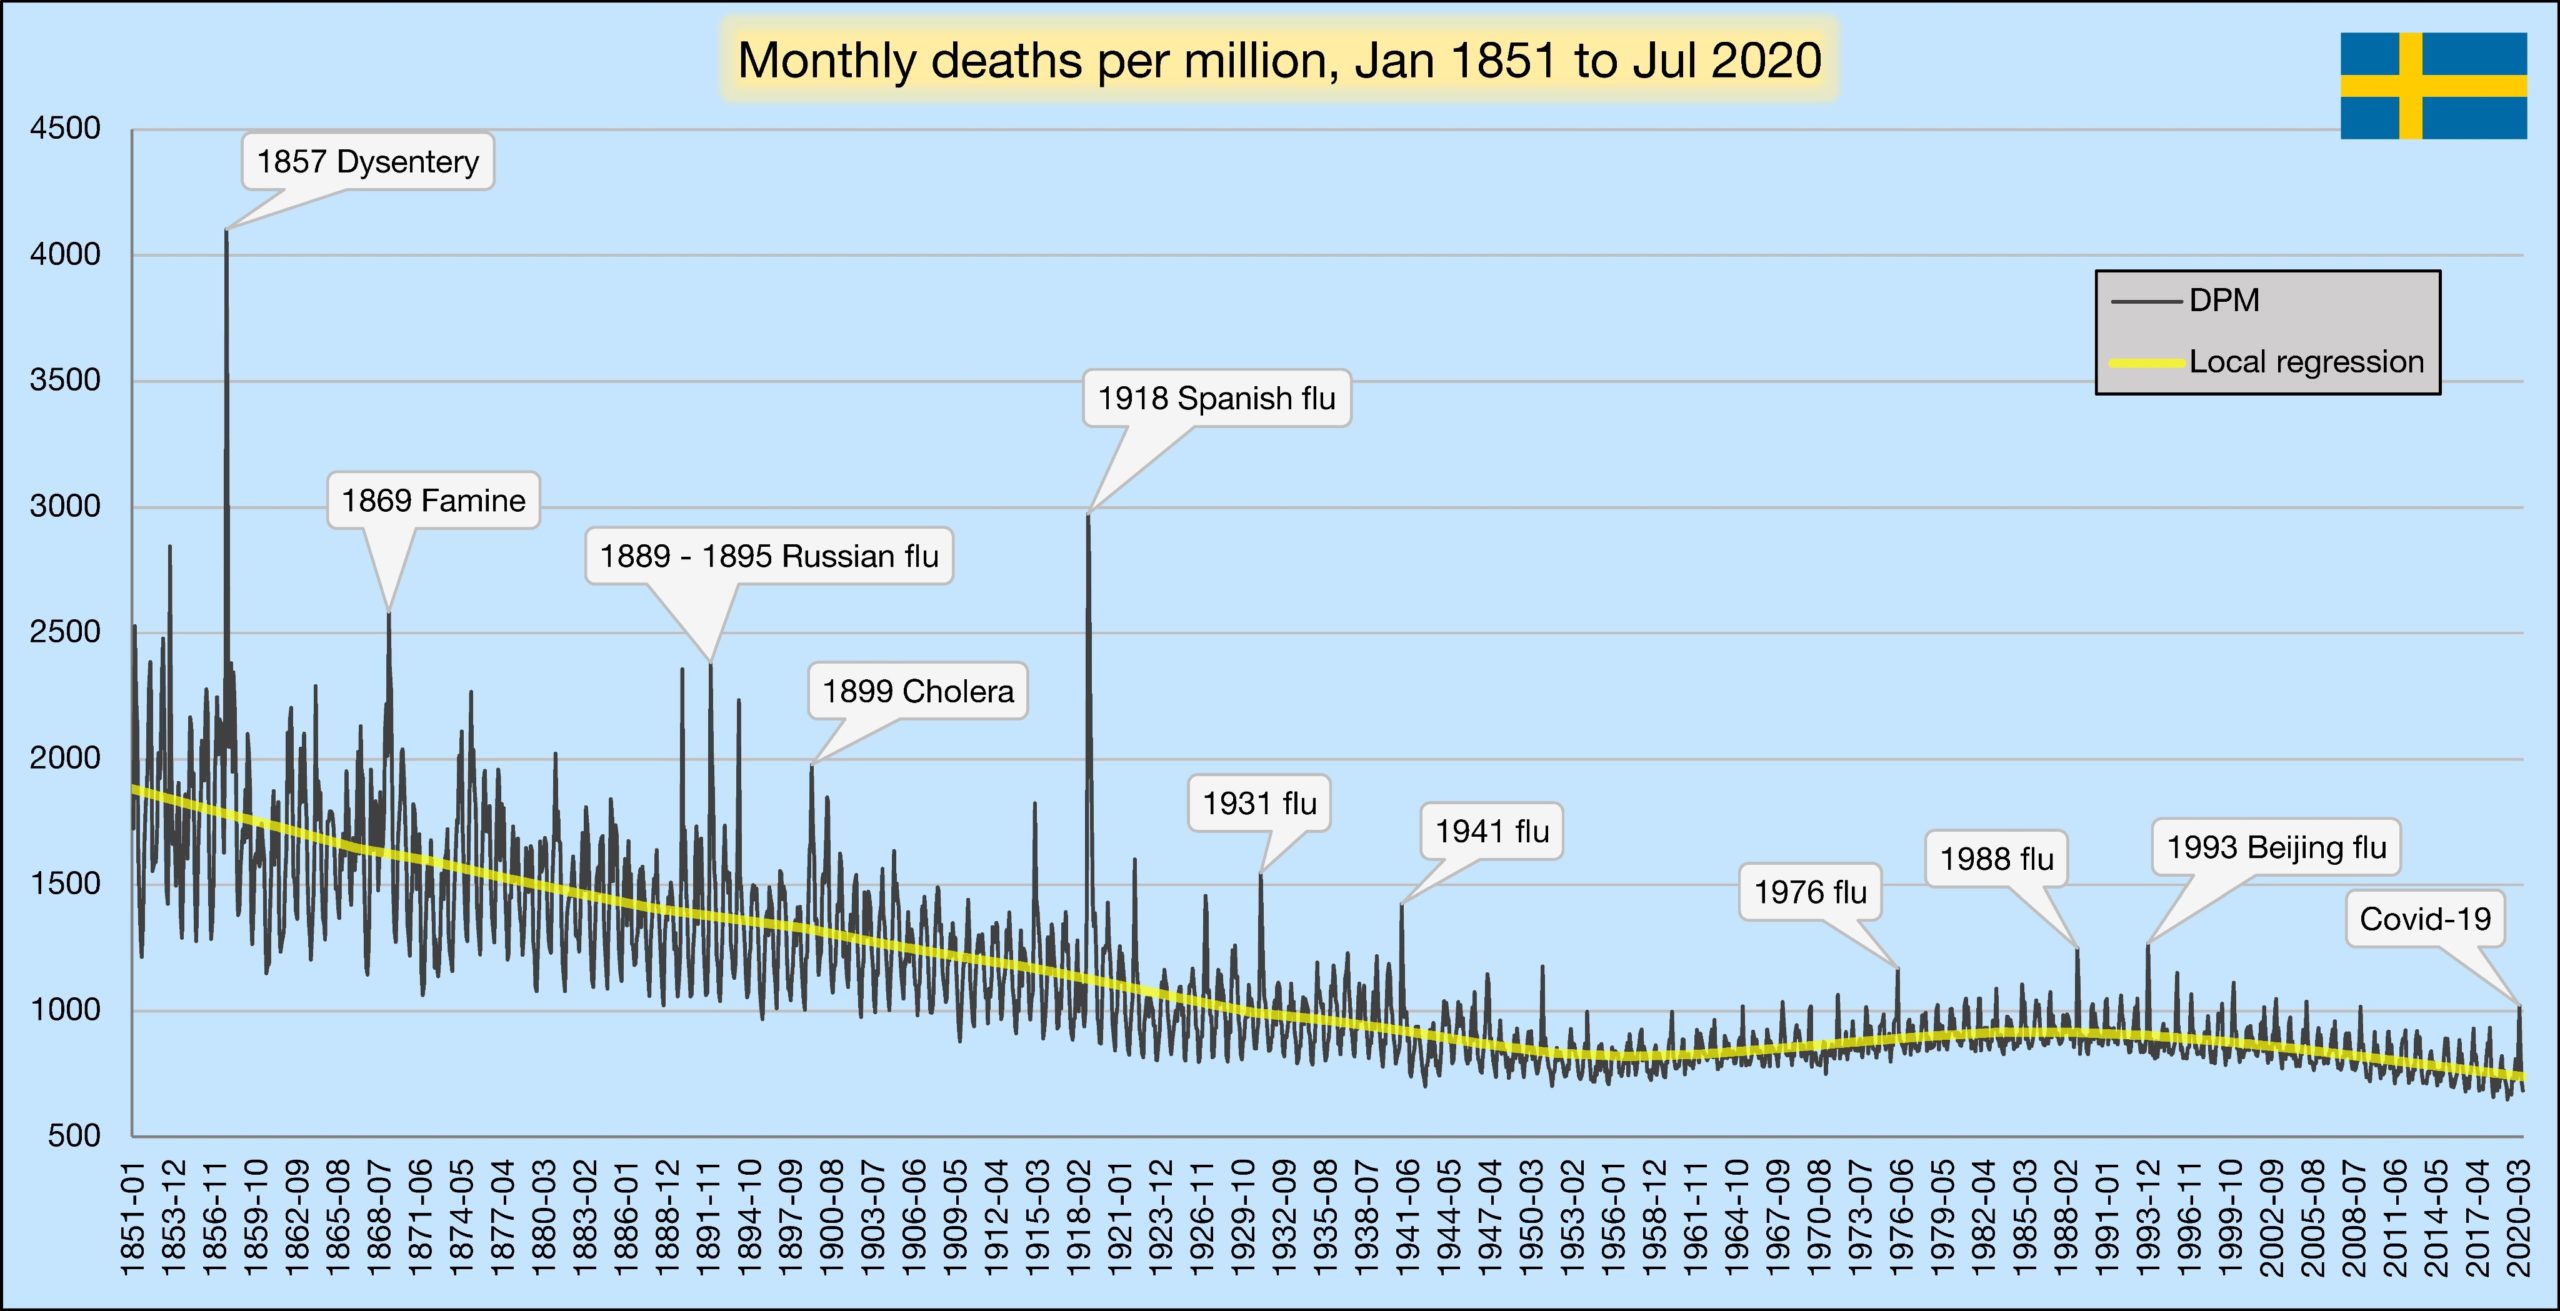
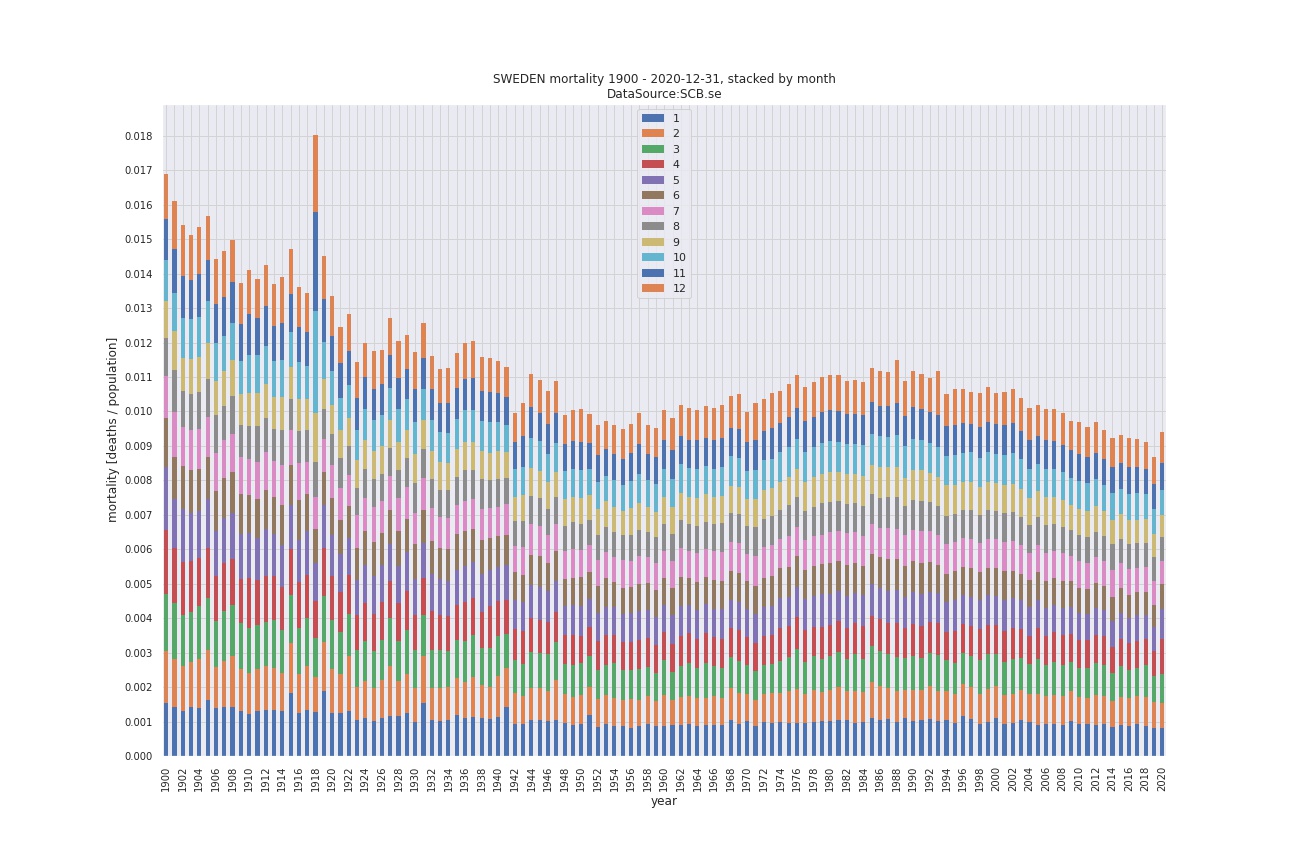
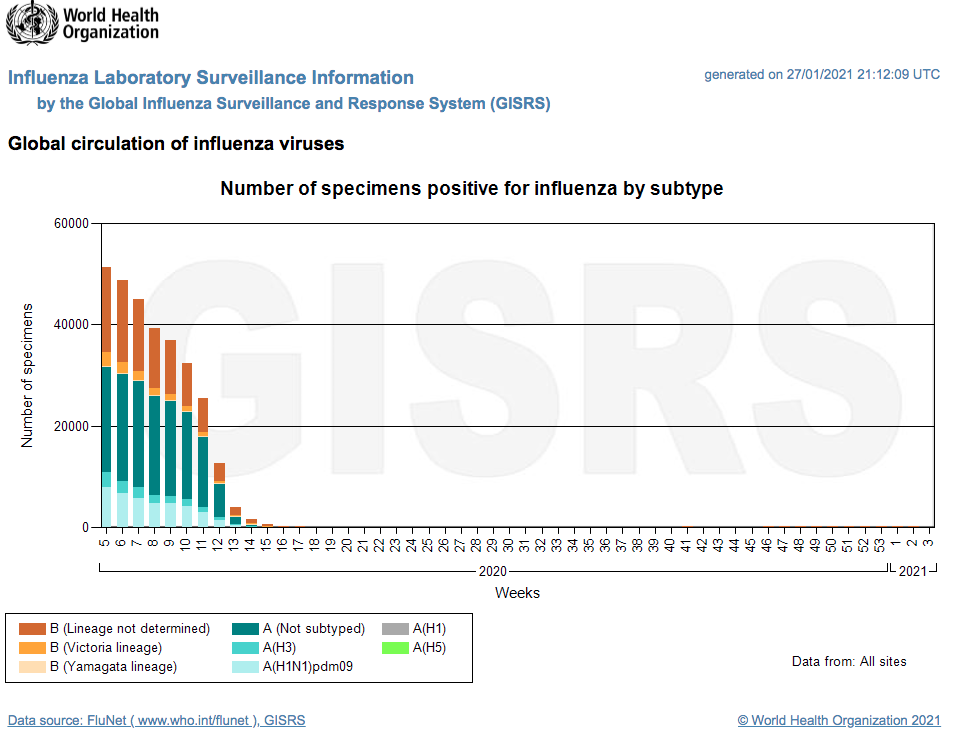
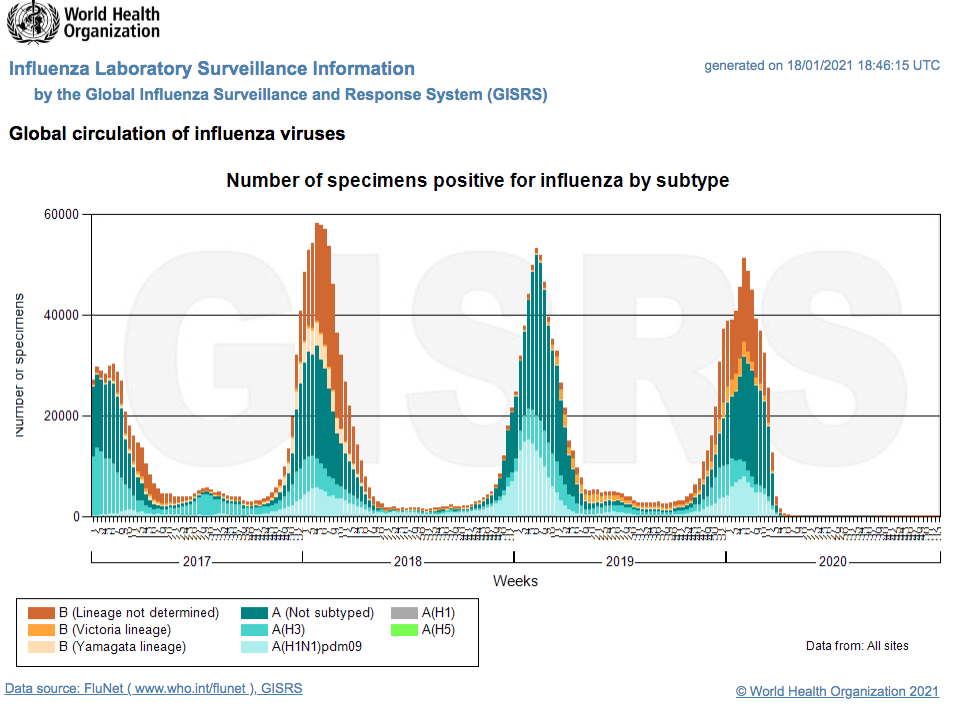
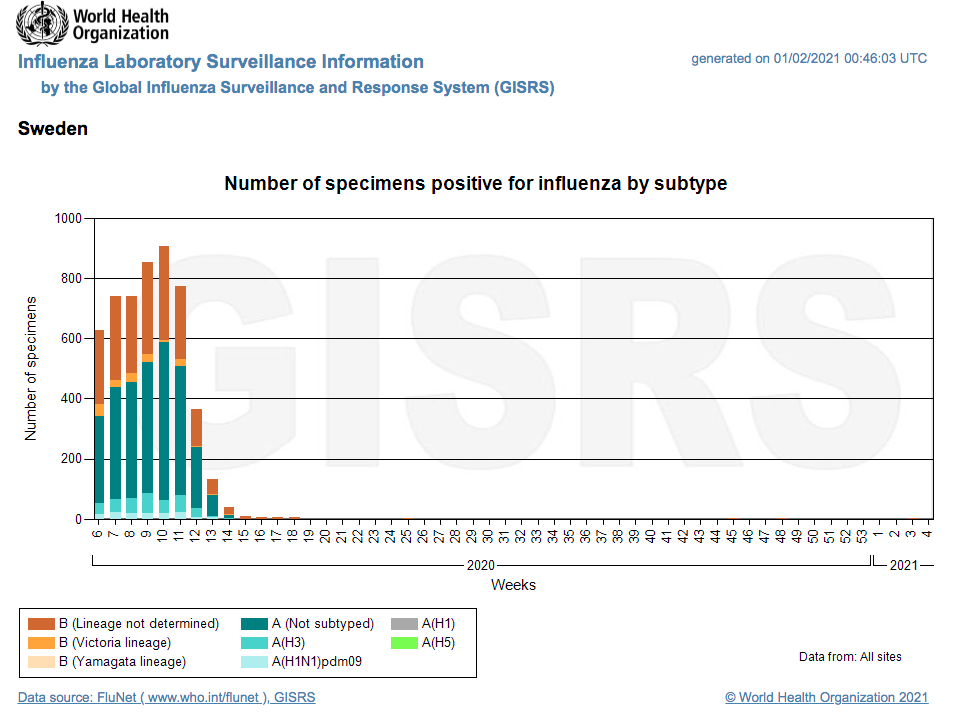
FLU
Flu waves occur every year. Different viruses are involved, mainly influenza and corona viruses.
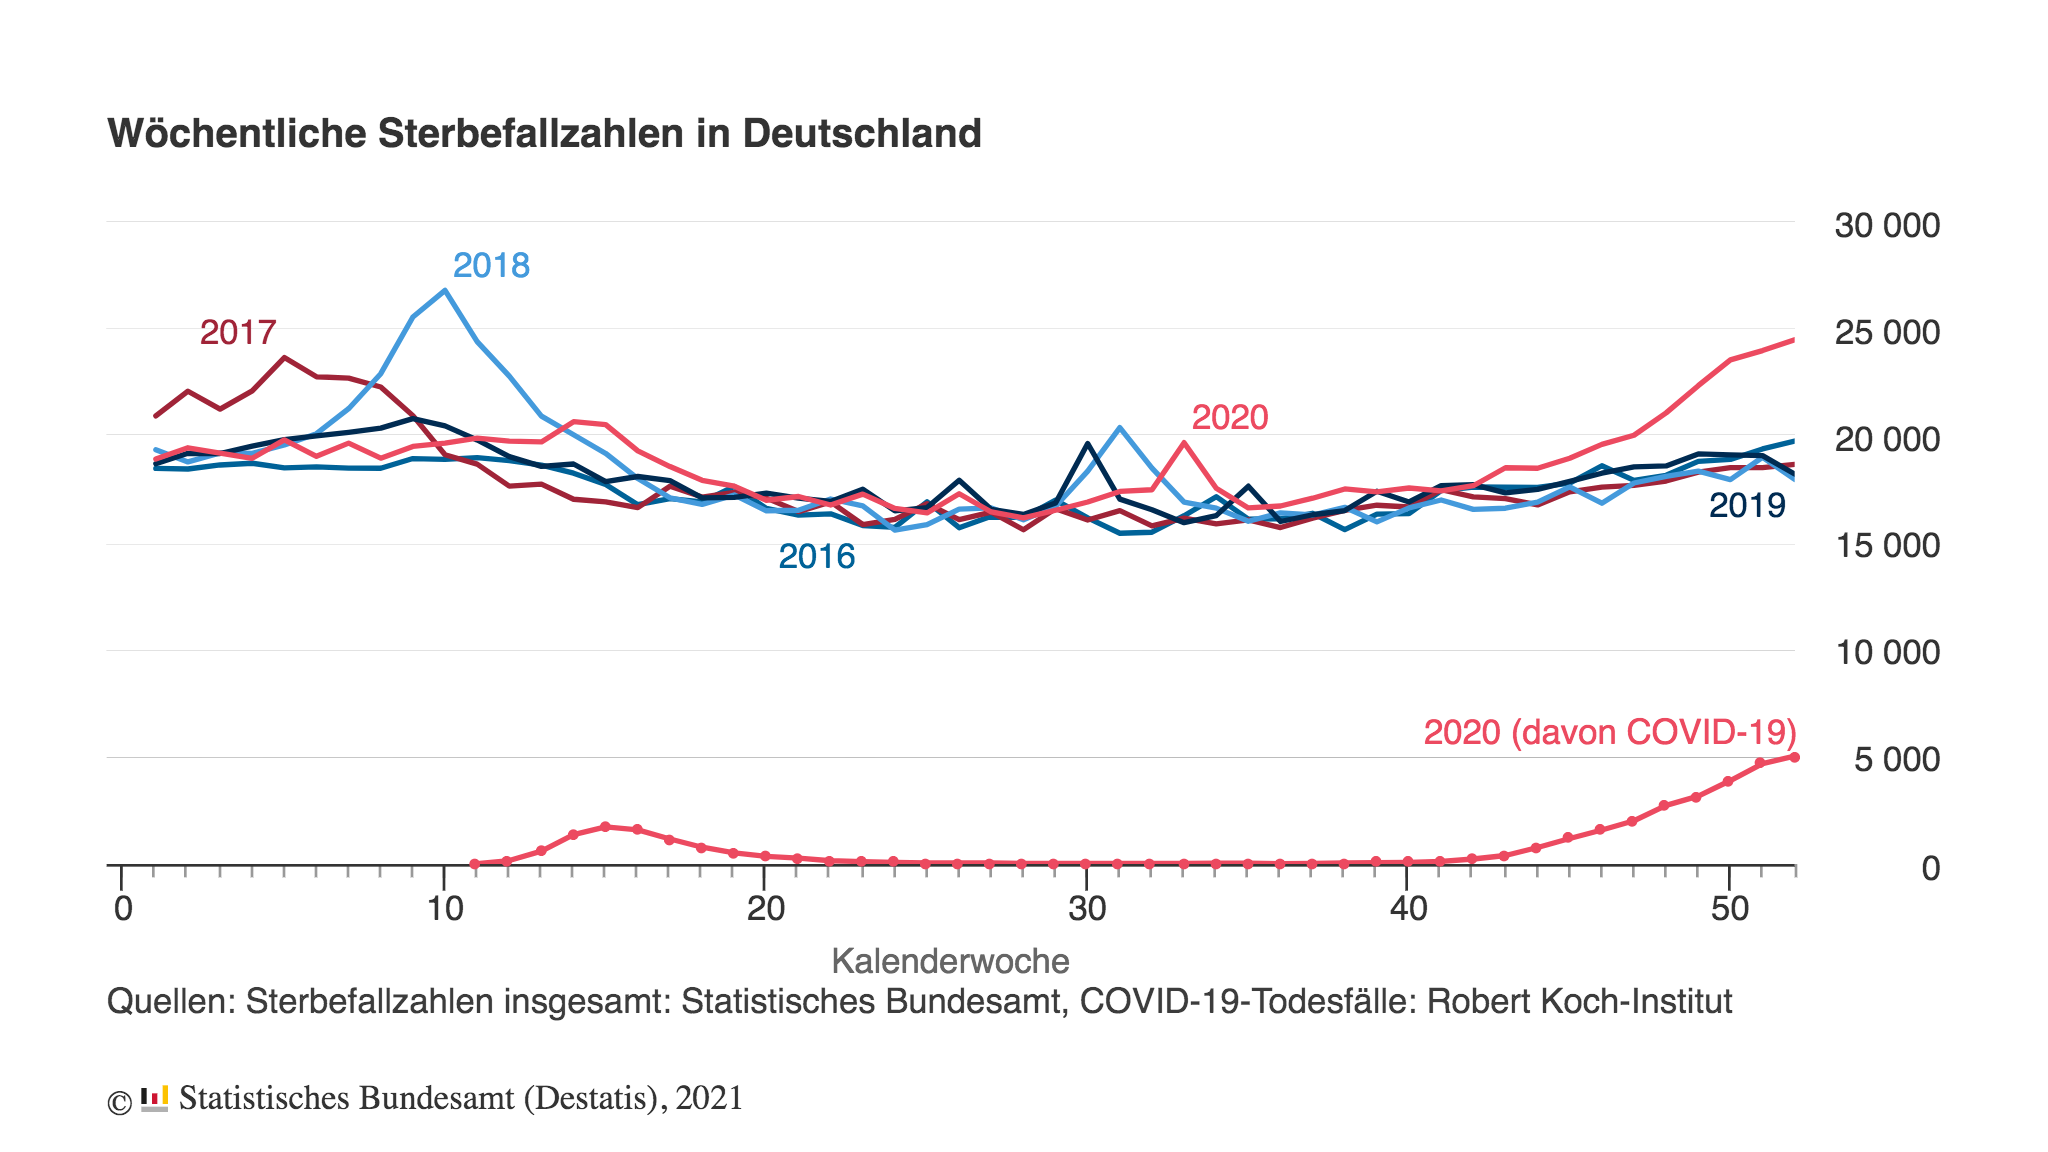
Normal case mortality with influenza or corona viruses is 0.1-0.2% sometimes like in 2017/2018 up to 1%.

COVID-19

October 2020
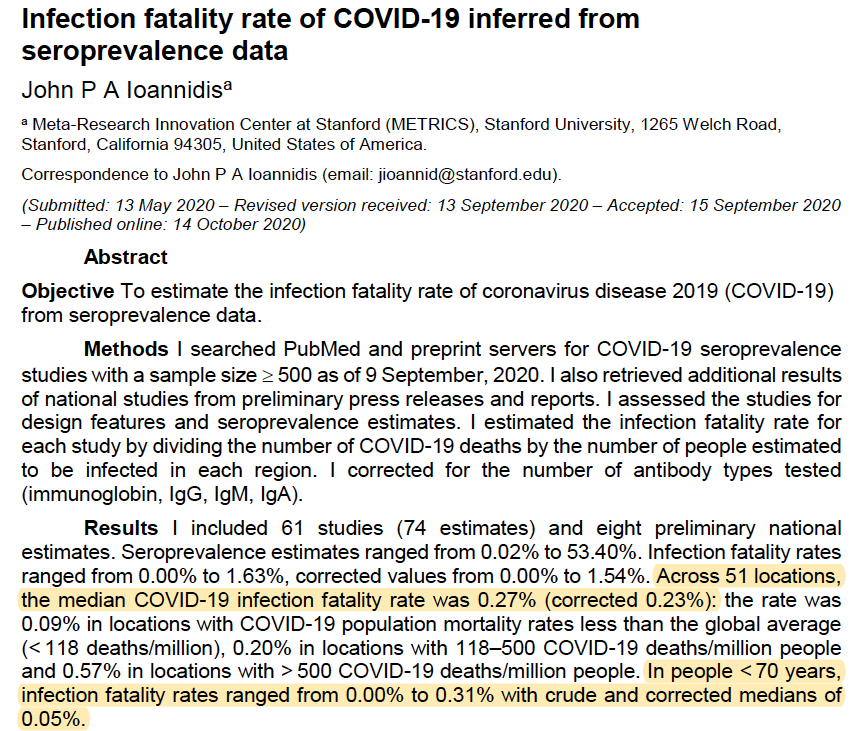
Bulletin of the World Health Organization / Infection fatality rate study by Prof. Ioannidis, Stanford University
Median COVID-19 infection fatality rate was 0.27% (corrected 0.23%)
People younger than 70 years, infection fatality rates ranged from 0.00% to 0.31% with crude and corrected medians of 0.05%.
https://onlinelibrary.wiley.com/doi/10.1111/eci.13423

October 12, 2020
IPAK PHPI:
Americans in the age of 0- 19, 20-49 and 50 to 69 demographics are at extremely low risk of fatality due to COVID-19

September 2020
John P.A. Ioannidis:
The median COVID-19 infection fatality rate was 0.23%
Younger than 70 infection fatality rates range from 0.00% to 0.31% and a median of 0.05%

September 10, 2020
CDC COVID-19 Pandemic Planning Scenarios
The risk of dying of COVID-19 at an age below 65 years: 0.00003 to 0.05%, for 70+ is 0.054 and for over 80 years: 1-2%

Age-specific survival rates:
0-19 years old 99.997%
20-49 years old, 99.98%
50-69 years, 99.5%
70 years old or older 94.6%
https://www.cdc.gov/coronavirus/2019-ncov/hcp/planning-scenarios.html#table-2

This is just in the range of a moderately severe flu wave.

April 2020
According to the German Heinsberg study by Prof. Streeck, infection fatality rate for all is in the range between 0.24% and 0.26% maximum 0.36% and a mortality (based on population) of 0.06%.

Conclusion: Covid-19 is definitely NOT a killer virus but comparable to a moderately severe influenza.

 …… find more information here.

October 12, 2020
COVID-19 Data Collection, Comorbidity & Federal Law: A Historical Retrospective
According to the Centers for Disease Control and Prevention (CDC) on August 23, 2020, “For 6% of the deaths, COVID-19 was the only cause mentioned. For deaths with conditions or causes in addition to COVID-19 , on average, there were 2.6 additional conditions or causes per death.”

Americans in the age 0 to 19, 20 to 49, and 50 to 69 demographics are at extremely low risk of fatality due to COVID-19 . Recovery rates rise even higher if the methods for recording cause of death reporting based upon the March 24, 2020 COVID-19 Alert No. 2 guidelines are proven to have violated the PRA & IQA.

The CDC published guidelines on March 24, 2020 that substantially altered how cause of death is recorded exclusively for COVID-19.
Due to this guideline
– there was significant inflation of COVID-19 case and fatality data.
– People hospitalized with a positive PCR test could be tested every 24 hours and each time counted as new COVID-19 to the complete absence of basic rules.
https://jdfor2020.com/wp-content/uploads/2020/11/adf864_165a103206974fdbb14ada6bf8af1541.pdf

Due to mislabeling of the deaths worldwide the flue began to disappear in early February 2020 and was totally gone in mid April 2020 worldwide – long before any lockdowns or mask mandates could have had any impact on the flu.
https://apps.who.int/flumart/Default?ReportNo=10

August 18, 2021

On January 18, 2021 I checked the Global circulation of influenza viruses on the WHO website.
It was possible to select different regions, countries as wells as dates and time frames.

Today August 18, 2021 I tried to find the same information for the past view months but found that WHO eliminated the pages & function.
We have to wonder why?

October 14, 2020
Bulletin of the World Health Organization
Median COVID-19 infection fatality rate only 0.23%

Research study by John P.A. Ioannidis / Meta-Research Innovation Center at Stanford (METRICS), Stanford University, USA
The median COVID-19 infection fatality rate is only 0.23% (people < 70 just 0.05%). Hence, the so-called infectious mortality is much lower than many feared – and than official mortality figures indicate.
https://www.who.int/bulletin/online_first/BLT.20.265892.pdf

The Invented Pandemic, the Lack of Virus Isolation and the Invalid COVID-19 Test.

September 10, 2020
CDC COVID-19 Pandemic Planning Scenarios
https://www.cdc.gov/coronavirus/2019-ncov/hcp/planning-scenarios.html#table-1

October 7, 2020
Study by John P.A. Ioannidis / Meta-Research Innovation Center at Stanford (METRICS), Stanford University, USA

Global perspective of COVID‐19 epidemiology for a full‐cycle pandemic.
About 10% of the
global population may be infected by October 2020. Global infection fatality rate is 0.15‐0.20% and 0.03‐0.04% in those younger than 70 years.
https://onlinelibrary.wiley.com/doi/10.1111/eci.13423

The Physicians For Informed Consent (PIC)
COVID-19: Assessing Infection Severity

USA

Age-adjusted death rates / deaths per 1000 United States 1900 – 2020

Monthly All Cause Deaths per 1 MM People 1960 – 2020

US: Monthly age-adjusted mortality since 1900

COVID-19 deaths in New York and Florida

Europe

Germany

The number of deaths in Germany in 2020 is not higher than in other years with a normal flu season. The weekly mortality numbers in Germany are from the German Federal Statistical Office/ Robert Koch-Institut/RKI
https://www.destatis.de/DE/Themen/Gesellschaft-Umwelt/Bevoelkerung/Sterbefaelle-Lebenserwartung/sterbefallzahlen.html
The weekly mortality numbers of 2020 are displayed together with the numbers from 2016/2017/2018/2019.
You can clearly see that there is no excess mortality, that the figures are even lower than in the influenza year of 2018.

Statista – German Mortality Rates In Germany, the mortality rate has been at the level of previous years https://de.statista.com/infografik/21523/anzahl-der-sterbefaelle-in-deutschland/

German Mortality 1990 – 2020

UK

Cumulative Deaths England & Wales 2019/2020 compared to 1999/2000

How can you explain the increase of deaths labelled as COVID-19 in Autumn while emergency department acute respiratory attendance are way below expectations in UK? – via Joel Smalley

As COVID labelled deaths rise and fall, deaths from other causes seem to do the opposite – via Joel Smalley

Switzerland

Swiss Mortality 1990 – 2020

Sweden

Sweden 1851 – 2020

EuroMomo – Mortality monitoring and analyses in European countries EuroMomo clearly shows the excess (or non-existent) mortality in the EU. First you see a graph showing summarized Europe-wide values with a peak level from 22 March to 17 May and afterwards only a death rate like during the influenza in 2017/2018.
For Germany, only Berlin and Hesse are listed, which do not even show any excess deaths for 2020 and only average values throughout. The flu seasons in 2017, 2018 / 2019 had a much higher peak than COVID-19 in 2020. You can compare the different countries and see the distribution in the different age groups.
For everyone up to 44 years of age there are no different numbers than in other years. For 45-64 year old people there was a spike in March/April 2020, but the other numbers are equally to the flu season of 2017/2018 the same applies to the 65 year old and above. https://www.euromomo.eu/graphs-and-maps

Worldwide Mislabeling of other diseases worldwide

Global circulation of influenza viruses
Starting in KW 6 / on Monday, February 3rd, 2020 the influenza started to disappear and was totally eliminated worldwide KW 15 / on Monday April 6th, 2020 and has not re-appeared ever since. The USA went into lockdown end of March/mid April, very few states mandated masks beginning April 1st, most in May. So the flu has not been eliminated due to restrictions like lockdowns or masks.
https://apps.who.int/flumart/Default?ReportNo=6

Sweden
Sweden never had a lockdown, social distancing nor mask regulations, but the flu disappeared in week 14 and has not been back up to this day February 2, 2021.

A closer look at U.S. deaths due to COVID-19
The total decrease in deaths by other causes almost exactly equals the increase in deaths by COVID-19. COVID-19 death toll might be misleading, deaths due to heart diseases, respiratory diseases, influenza and pneumonia may instead be recategorized as being due to COVID-19.

The hospitalization & mortality numbers are not accurate
CDC’s Guidance for Certifying Deaths Due to Coronavirus Disease 2019 (COVID–19)
https://www.cdc.gov/nchs/data/nvss/vsrg/vsrg03-508.pdf

CDC Guidelines

Page six of the “Guidance for Certifying Deaths Due to Coronavirus Disease 2019” shows the problem:
Without testing and just because she was exposed to an individual with a positiv PCR test the death certificate can say:
Cause of Death: Probable COVID-19. “Probable Covid” is listed as COVID-19 death. With this directive every for-profit hospital company is empowered and encouraged to generate more revenue. Since the PCR Test creates many false positives this manipulation creates even more COVID deaths, for the profit of an hospital.

WHO – Guideline Cause of Death
These are the instructions directly from the World Health Organisation/WHO (which was certainly issued worldwide): https://www.who.int/classifications/icd/Guidelines_Cause_of_Death_COVID-19.pdf

US hospitals get more funding by marking individuals diagnosed with COVID-19 deaths certificates COVID-19 related.
Section 3710 of the CARES Act directs the Secretary to increase the weighting factor of the assigned Diagnosis-Related Group (DRG) by 20 percent for an individual diagnosed with COVID-19 discharged.
https://www.cms.gov/files/document/se20015.pdf

ICD-10-CM Official Coding and Reporting Guidelines
April 1, 2020 through September 30, 2020
https://www.cdc.gov/nchs/data/icd/COVID-19-guidelines-final.pdf

Codes

Hospitals are being reimbursed for treatment of COVID-19 for the uninsured with an increased payment
Under the CARES Act hospitals are being reimbursed for treatment of COVID-19 for the uninsured. The average payments was increased by 20% to account for the add-on to Medicare inpatient reimbursement for patients with COVID19 that was included in the CARES Act “For less severe hospitalizations, we use the average Medicare payment for
respiratory infections and inflammations with major comorbidities or complications in 2017, which was $13,297. For more severe hospitalizations, we use the average Medicare payment for a respiratory system diagnosis with ventilator support for greater than 96 hours, which was $40,218. Each of these average payments was then increased by 20% to account for the add-on to
Medicare inpatient reimbursement for patients with COVID-19 that was included in the CARES Act.
Based on the above, we estimate total payments to hospitals for treating uninsured patients under the Trump administration policy would range from $13.9 billion to $41.8 billion.”
https://www.kff.org/uninsured/issue-brief/estimated-cost-of-treating-the-uninsuredhospitalized-with-covid-19/
It would be naive to think that FOR-PROFIT hospitals will not take advantage
of this additional source of income, especially when they had to stop almost all other treatments during corona, had to close hospitals and sent nurses home, and thus generate much less revenue than under normal circumstances. The CDC and WHO guidelines make it easy to designate cases as COVID even if they are not 100% confirmed as COVID, nor tested as COVID.

Worldwide Mislabeling of other diseases worldwide

See above the Global circulation of influenza viruses
Starting in KW 6 / on Monday, February 3rd, 2020 the influenza started to disappear and was totally eliminated worldwide KW 15 / on Monday April 6th, 2020 and has not re-appeared ever since. The USA went into lockdown end of March/mid April, very few states mandated masks beginning April 1st, most in May. So the flu has not been eliminated due to restrictions like lockdowns or masks.
https://apps.who.int/flumart/Default?ReportNo=6

August 18, 2021

On January 18, 2021 I checked the Global circulation of influenza viruses on the WHO website.
It was possible to select different regions, countries as wells as dates and time frames.

Today August 18, 2021 I tried to find the same information for the past view months but found that WHO eliminated the pages & function.
We have to wonder why?

A closer look at U.S. deaths due to COVID-19
The total decrease in deaths by other causes almost exactly equals the increase in deaths by COVID-19. COVID-19 death toll might be misleading, deaths due to heart diseases, respiratory diseases, influenza and pneumonia may instead be recategorized as being due to COVID-19.

All information is deemed accurate but not guaranteed and should be independently verified.